[Yocto-BBB] 18. GDB debugging through recipe-sysroot
Translated from the Vietnamese original; wording may still be rough. Read the original →
In this post I show you how to debug a binary built by a recipe using the recipe-sysroot in that recipe's output folder.
1. What is a sysroot?
Sysroot means system root: a folder acting as a virtual root filesystem for cross-compiling. It contains the header files, libraries and artifacts the compiler/linker needs to build code for the target without running on the target.
The sysroot is part of the toolchain; when you install an SDK, the toolchain usually comes with a generic sysroot good enough for any kind of build.
In Yocto, each recipe has its own recipe-sysroot, created from exactly that recipe's dependencies (DEPENDS), which keeps recipes independent of each other.
The theory can get long, but once we get hands-on you will see right away what it looks like
2. Build a simple recipe and explore recipe-sysroot
2.1 Create and build a recipe
I create a new meta layer to keep things easy to follow, and add it to the config
source oe-init-build-env build-bbb
bitbake-layers create-layer ../meta-example
bitbake-layers add-layer ../meta-example
Then create and edit example_0.1.bb
zk47@ltu:~/Youtube/Yocto/yocto-bbb/poky/meta-example$ tree
.
├── conf
│   └── layer.conf
├── COPYING.MIT
├── README
└── recipes-example
    └── example
        ├── example
        │   └── example.c
        └── example_0.1.bb

4 directories, 5 files
The example.c file is extremely simple
#include

int main()
{
    printf("Demo for debugging using recipe-sysroot");
    return 0;
}
The example_0.1.bb file
SUMMARY = "Demo for debugging using recipe-sysroot"
DESCRIPTION = "Demo"
LICENSE = "CLOSED"

FILESEXTRAPATHS:prepend := "${THISDIR}/${PN}:"

SRC_URI = "file://example.c"

S = "${WORKDIR}"

do_compile(){
    ${CC} ${LDFLAGS} -o example -g ${S}/example.c
}

do_install(){
    install -d ${D}${bindir}
    install -m 0755 example ${D}${bindir}/example
}
And build
bitbake example
2.2 The structure of recipe-sysroot
After the build, my output is at
zk47@ltu:~/Youtube/Yocto/yocto-bbb/poky/build-bbb/tmp/work/armv7at2hf-neon-poky-linux-gnueabi/example/0.1$ tree -L 1
.
├── configure.sstate
├── debugsources.list
├── deploy-rpms
├── deploy-source-date-epoch
├── example
├── example-0.1
├── example.c
├── example.spec
├── hello.c
├── image
├── license-destdir
├── package
├── packages-split
├── patches
├── pkgdata
├── pkgdata-pdata-input
├── pkgdata-sysroot
├── pseudo
├── recipe-sysroot
├── recipe-sysroot-native
├── source-date-epoch
├── spdx
├── sysroot-destdir
└── temp

18 directories, 6 files
You will see there are even 2 recipe-sysroot folders here,
recipe-sysroot-native contains the tools that run on the host (for example, on my machine, for x86_64)
And recipe-sysroot contains a whole set of things needed for building
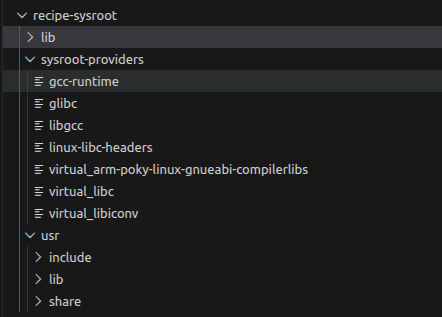
3. Configure QEMU user mode to start a GDB server
To run gdb we still need some host, so we use QEMU with a host matching the target we want
Something like this
${QEMU_PATH} -L {SYSROOT} -g ${PORT} ${PATH_TO_BINARY}
QEMU_PATH: for the beaglebone black build, we find it at build-bbb/tmp/sysroots-components/x86_64/qemu-native/usr/bin/qemu-arm
SYSROOT: exactly the sysroot I mentioned above build-bbb/tmp/work/armv7at2hf-neon-poky-linux-gnueabi/example/0.1/recipe-sysroot
PORT: pick any; I pick 58000
PART_TO_BINARY: the path to the debug binary /build-bbb/tmp/work/armv7at2hf-neon-poky-linux-gnueabi/example/0.1/package/usr/bin/example
(I don't know why, but if I use the binary directly in .debug it segfaults. So I switched to the original executable)
So in full, on my machine, this starts the gdb server
/home/zk47/Youtube/Yocto/yocto-bbb/poky/build-bbb/tmp/sysroots-components/x86_64/qemu-native/usr/bin/qemu-arm -L /home/zk47/Youtube/Yocto/yocto-bbb/poky/build-bbb/tmp/work/armv7at2hf-neon-poky-linux-gnueabi/example/0.1/recipe-sysroot -g 58000 /home/zk47/Youtube/Yocto/yocto-bbb/poky/build-bbb/tmp/work/armv7at2hf-neon-poky-linux-gnueabi/example/0.1/package/usr/bin/example
4. Configure the GDB client, launch.json
Install the following extension in Visual Studio Code
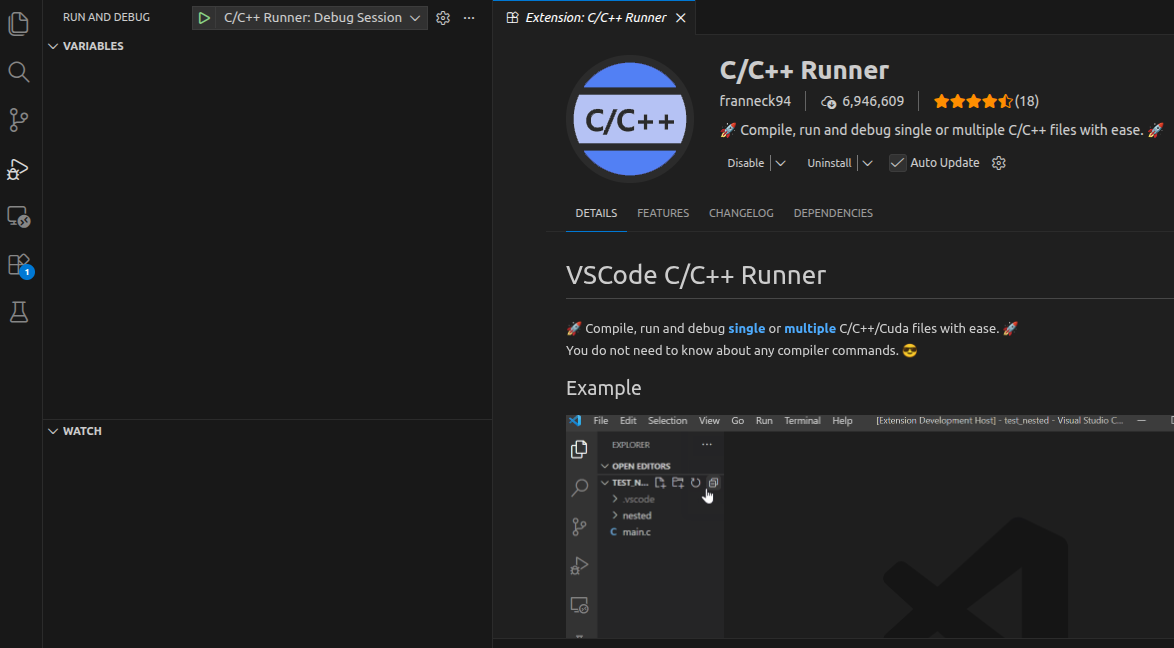
Then click start debug; it will say there is no launch.json configuration yet, so click create
One note: you must create launch.json in the folder where you want to run the debugger; for example here I open the output folder first and then create it
/home/zk47/Youtube/Yocto/yocto-bbb/poky/build-bbb/tmp/work/armv7at2hf-neon-poky-linux-gnueabi/example/0.1
We change the file content to the following
{
  "version": "0.2.0",
  "configurations": [
    {
      "name": "C/C++ Runner: Debug Session",
      "type": "cppdbg",
      "request": "launch",
      "args": [],
      "stopAtEntry": false,
      "externalConsole": false,
      "cwd": "/home/zk47/Youtube/Yocto/yocto-bbb/poky/build-bbb/tmp/work/armv7at2hf-neon-poky-linux-gnueabi/example/0.1",
      "program": "/home/zk47/Youtube/Yocto/yocto-bbb/poky/build-bbb/tmp/work/armv7at2hf-neon-poky-linux-gnueabi/example/0.1/package/usr/bin/example",
      "MIMode": "gdb",
      "miDebuggerServerAddress": "localhost:58000",
      "miDebuggerPath": "gdb-multiarch",
      "setupCommands": [
        {
          "description": "Enable pretty-printing for gdb",
          "text": "-enable-pretty-printing",
          "ignoreFailures": true
        },
        {
            "description": "Set sysroot",
            "text": "set sysroot /home/zk47/Youtube/Yocto/yocto-bbb/poky/build-bbb/tmp/work/armv7at2hf-neon-poky-linux-gnueabi/example/0.1/recipe-sysroot"
        }
      ]
    }
  ]
}
Pay attention to the fields
- miDebuggerServerAddress: set the port you set up above
- miDebuggerPath: if you don't have it, install gdb-multiarch
- setupCommands: set the sysroot for the binary
Okay, in another terminal we start the gdb server, and here we start debugging in the extension :vv
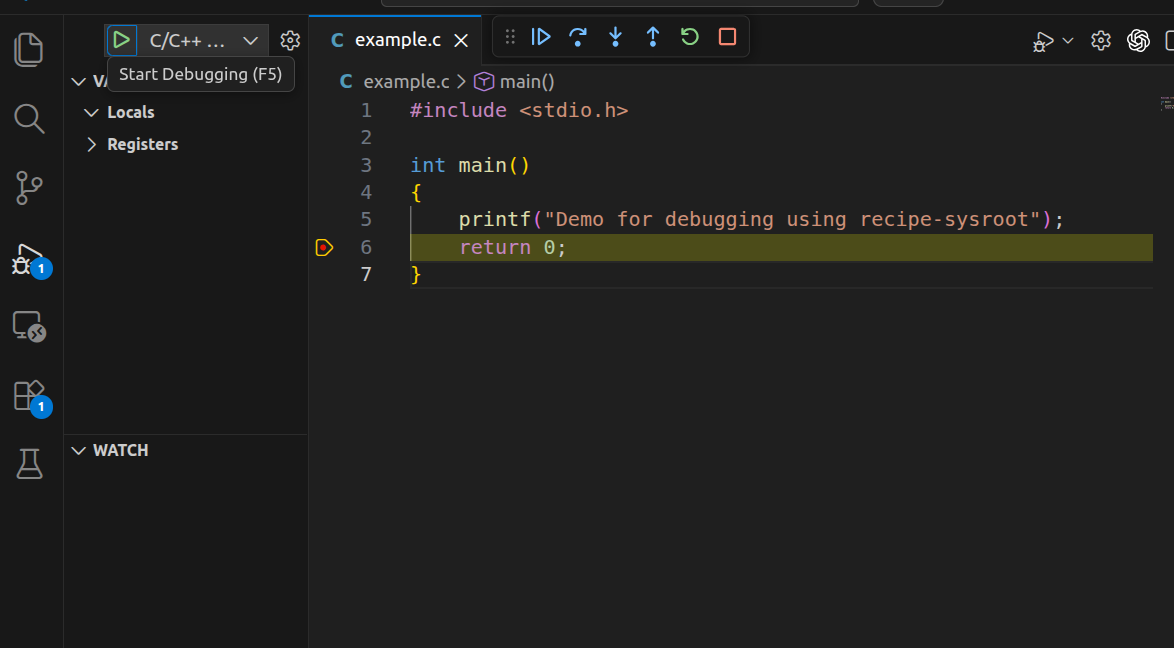
5. Benefits
You probably only appreciate this once you run into it. The example.c here is quite simple. But what you are seeing is me debugging an executable built for the beaglebone black on my own laptop, without the hardware.
In practice, not every service or application needs hardware, so being able to run tests like this speeds up development and bug hunting a lot
I once wrote unit tests for a service, and being able to debug the code like this boosted my productivity enormously :vv
Good luck with the hands-on.