[Kernel-BBB] 2. kgdbwait and the gdb server
Translated from the Vietnamese original; wording may still be rough. Read the original →
In this post I use kgdbwait so we can debug the kernel earlier (not as early as through JTAG) and also set up the gdb server so we can use the VS Code extensions :vv
1. Configuring the kernel command line
1.1 Finding the way
In the previous post I tried to change the boot command through u-boot, but in reality
=> printenv bootargs
## Error: "bootargs" not defined
And I checked further
=> printenv bootcmd
bootcmd=run findfdt; run init_console; run finduuid; run distro_bootcmd
distro_bootcmd means U-Boot uses distro boot: the bootargs are built from extlinux.conf on the boot partition, not from the env variables.
We have 2 options,
1 is to take the SD card out and edit /boot/extlinux/extlinux.conf directly
2 is to change it through local.conf.
I work with yocto, so I change it through local.conf. For those wondering where this bootcmd is set in the source code, it is here
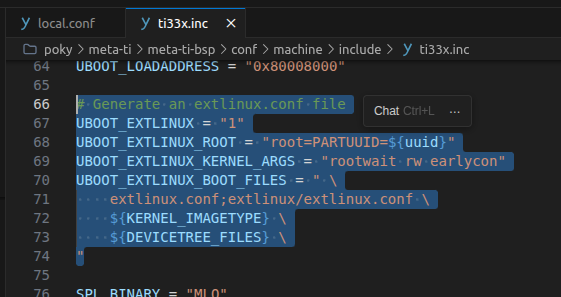
1.2 Changing the kernel command line through local.conf
We simply add the following line to local.conf
UBOOT_EXTLINUX_KERNEL_ARGS:append = " kgdboc=ttyS0,115200 kgdbwait"
Now rebuild core-image-minimal, then check the output in core-image-minimal's recipe-sysroot and we see
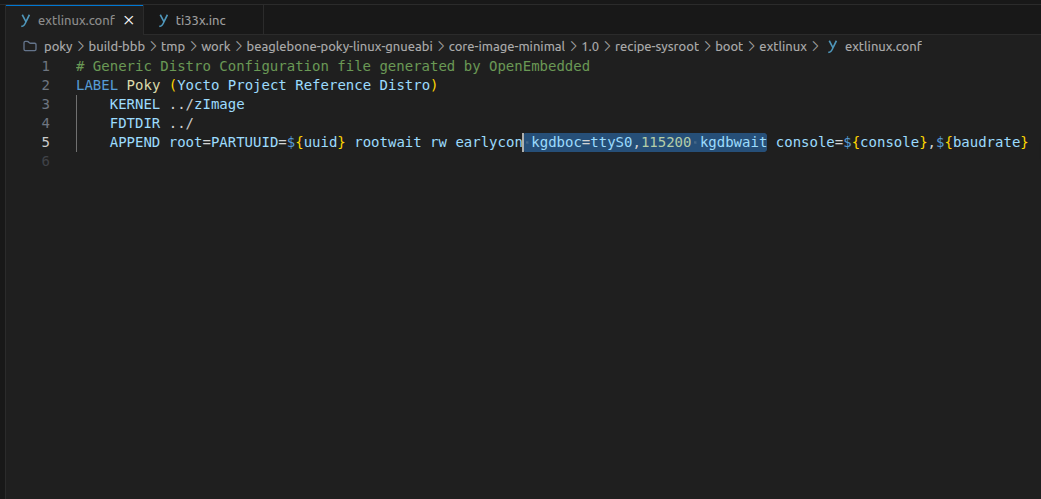
We can see kgdboc and kgdbwait have been added
2. Trying kgdbwait
Boot the board and you will see the following log line
[    4.514801] KGDB: Registered I/O driver kgdboc
[    4.533500] KGDB: Waiting for connection from remote gdb...
So it worked; now we open gdb on the pc
zk47@ltu:~$ sudo gdb-multiarch ~/Youtube/Yocto/yocto-bbb/poky/build-bbb/tmp/work/beaglebone-poky-linux-gnueabi/linux-bb.org/6.12.34+git/build/vmlinux
Oh, remember to close the serial UART in the other terminal, then we set up and connect exactly as in the previous post
(gdb) set serial baud 115200
(gdb) target remote /dev/ttyUSB0
Remote debugging using /dev/ttyUSB0
kgdbwait lets us debug before reaching login. Very useful when
- Debugging a driver probe that crashes (I2C, SPI, MMC, USB, ...)
- Debugging a failing filesystem mount
- Debugging buggy module loading
- Debugging a kernel panic at boot before reaching login
- The board cannot boot to userspace → you cannot
echo g
3. Setting up launch.json for VS Code Studio
3.1 Set up launch.json and try starting debug
I actually did a very similar setup once in Yocto-BBB 18 ; you can read that first
We open the linux-bb.org workdir and create launch.json
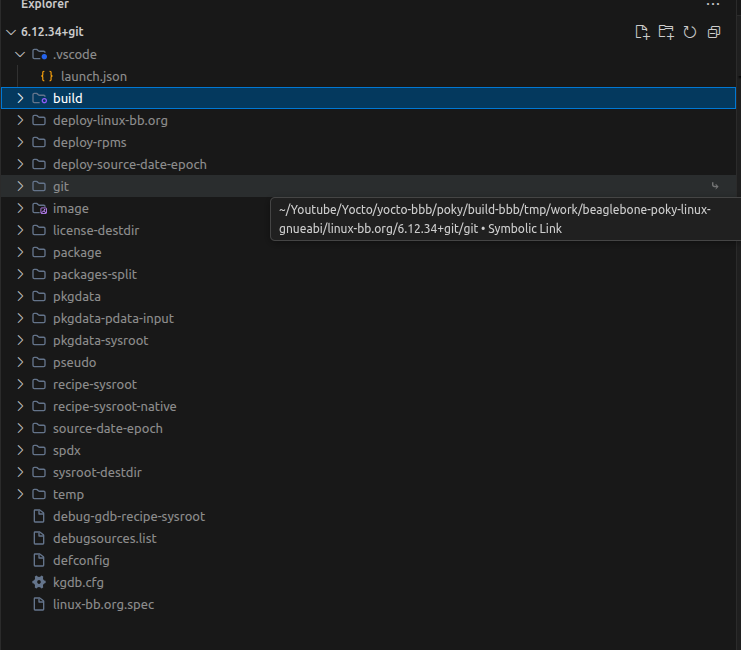
launch.json has the following content
{
  "version": "0.2.0",
  "configurations": [
    {
      "name": "KGDB Kernel Debug (BBB)",
      "type": "cppdbg",
      "request": "launch",
      "program": "${workspaceFolder}/build/vmlinux",
      "args": [],
      "stopAtEntry": false,
      "cwd": "${workspaceFolder}",
      "environment": [],
      "externalConsole": false,
      "MIMode": "gdb",
      "miDebuggerPath": "gdb-multiarch",
      "miDebuggerServerAddress": "/dev/ttyUSB0",
      "miDebuggerArgs": "-b 115200",
      "setupCommands": [
        {
          "description": "Map kernel source paths",
          "text": "set substitute-path /usr/src/kernel /home/zk47/Youtube/Yocto/yocto-bbb/poky/build-bbb/tmp/work-shared/beaglebone/kernel-source",
          "ignoreFailures": false
        },
        {
          "description": "Enable pretty-printing",
          "text": "-enable-pretty-printing",
          "ignoreFailures": true
        }
      ]
    }
  ]
}
Likewise, pay attention to fields such as
- miDebuggerPath
- miDebuggerServerAddress
- miDebuggerArgs
- setupCommands
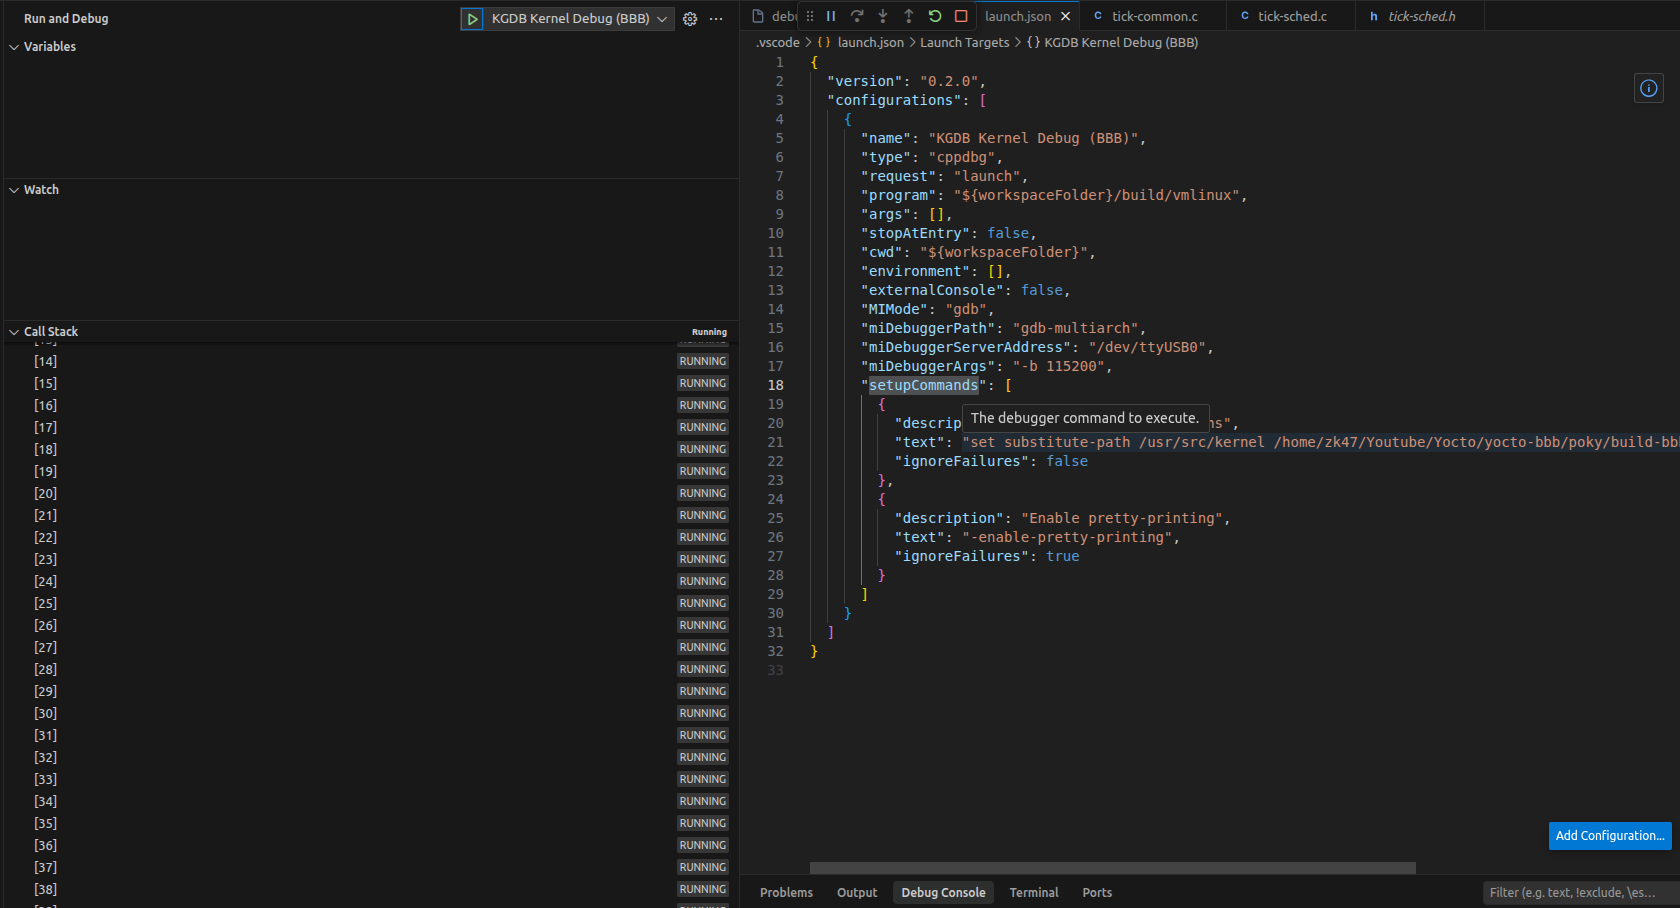
Then click debug and we get the debug interface, but the kernel keeps running and cannot be paused because we have not set a breakpoint
If you can get into the BBB terminal, run the following command to stop the kernel
echo g > /proc/sysrq-trigger
However, when it stops, it sends a reply signal to the GDB server; if KGDB on the VS Code side does not catch it, it stays running as in the picture above.
3.1 A trick to get into debugging
As I said above, if the timing does not match, GDB in VS Code cannot connect and times out
So we use a trick: schedule the debug trigger with a timer, then leave the serial terminal
Stop the debug session in VS Code and open the serial terminal
root@beaglebone:~# (sleep 10; echo g > /proc/sysrq-trigger) &
So only after 10s does it send the command to pause the kernel
Now in VS Code, wait 10s and start debugging again
Although it connects, we see the kernel keeps running again? Because we still have not set a breakpoint, but where should we put one so the kernel is sure to hit it?
Look at the board now: the LED is blinking, right? So we put it in the blinkled function, of course.
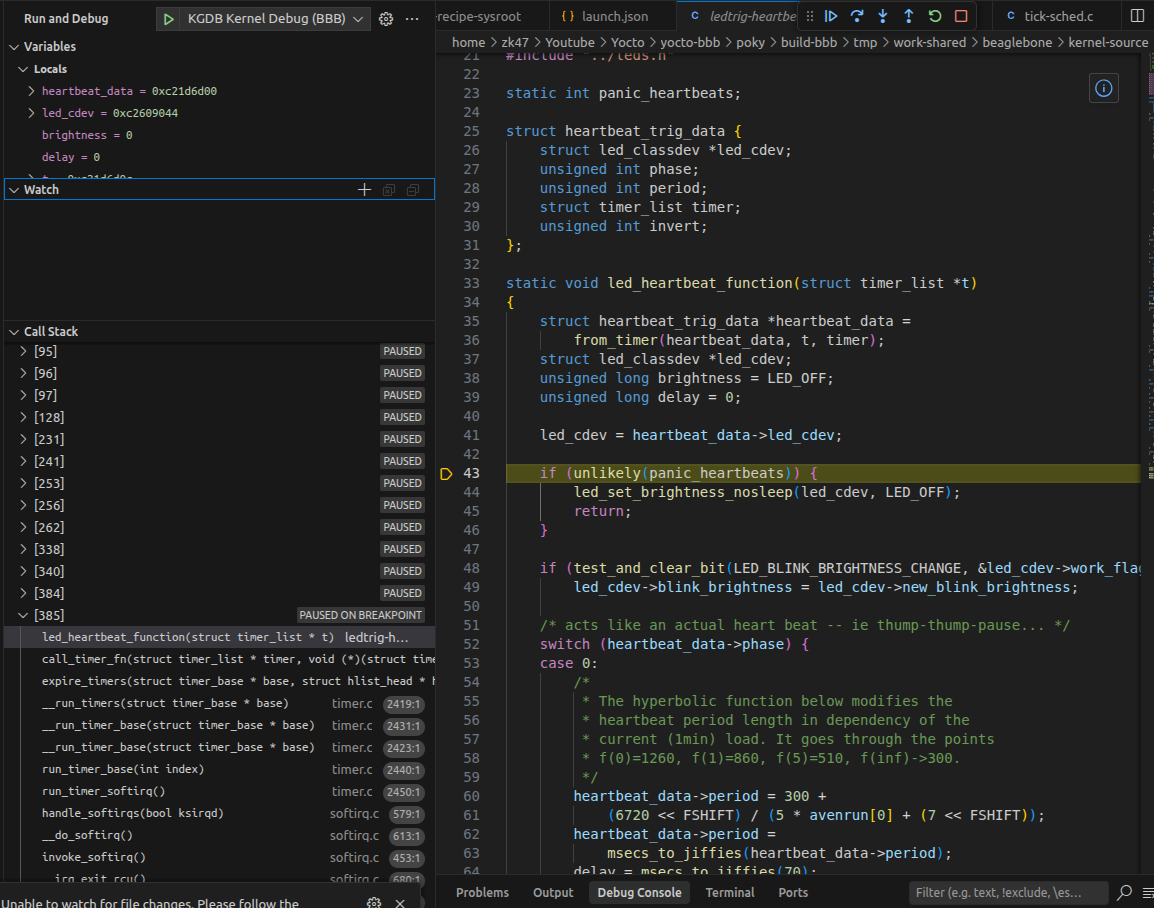
And now it stops; we can debug with a pretty nice interface :vv
Good luck with the hands-on !!
P/s: However, this is still not debugging the kernel from the very first line, so I will need to research more